In a world overflowing with information, making sense of raw data can feel like sifting through sand. Whether you're a student tackling a statistics assignment, a business analyst evaluating sales figures, or a researcher examining experimental results, organizing numerical data into a clear, understandable format is crucial. This is where the powerful, yet elegantly simple, stem and leaf plot comes into play, especially when aided by a generator.
A stem and leaf plot offers a unique blend of visual organization and data integrity, allowing you to quickly grasp the distribution of your numbers while preserving every single original value. It’s like getting a quick summary and the full story all at once. This hub will guide you through everything you need to know about these invaluable tools and how to leverage a stem and leaf plot generator to transform your raw data into actionable insights.
Unpacking the Basics: What Defines a Stem and Leaf Plot?
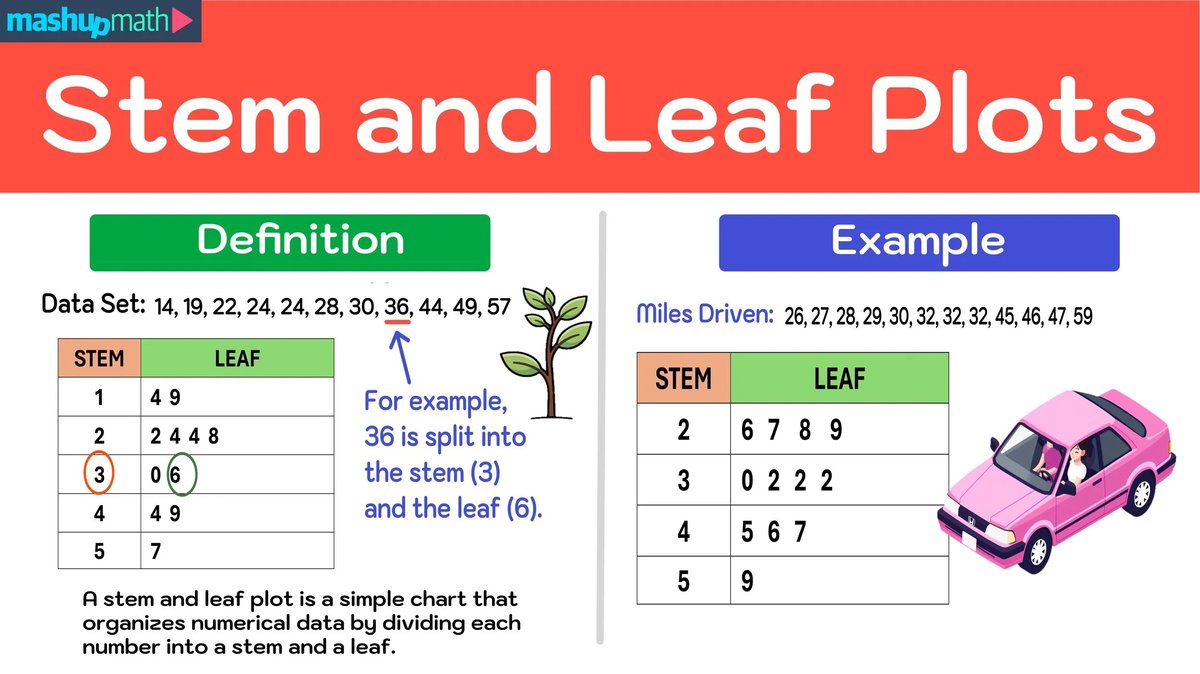
At its heart, a stem and leaf plot is a special type of table used to organize quantitative data. Imagine you have a list of numbers; a stem and leaf plot breaks each number into two parts: a "stem" (typically the leading digit or digits) and a "leaf" (usually the trailing digit). This simple division creates a visual display that resembles a histogram turned on its side, but with the added benefit of showing the actual data points.
The genius of this method lies in its ability to immediately reveal patterns, clusters, and even unusual values within your dataset. It’s a foundational technique in exploratory data analysis that gives you an immediate feel for your numbers. To truly grasp the anatomy and purpose of this unique visualization, dive into our comprehensive guide on What are Stem and Leaf Plots.
Boost Your Efficiency: Why Use a Stem and Leaf Plot Generator?
While understanding the manual process of creating these plots is valuable, modern tools—specifically stem and leaf plot generators—offer unmatched speed and accuracy. Manually sorting through dozens or hundreds of data points, splitting them, and arranging them can be time-consuming and prone to error. A generator automates this entire process.
Simply input your data, and the generator swiftly constructs a perfectly ordered plot, complete with the essential 'key' that explains how to read it. This efficiency allows you to spend less time on tedious calculations and more time on interpreting the insights your data provides. Discover how to get the most out of these powerful tools and Effectively use the generator Master your workflow for maximum impact.
Decoding the Display: Interpreting Data from Your Plots
Creating a stem and leaf plot is just the first step; the real value comes from understanding what it tells you. These plots are rich with visual cues that reveal the shape of your data's distribution. You can quickly identify whether your data is symmetrical, skewed to one side, or spread out evenly.
Look for areas where leaves cluster heavily—these indicate the central tendency of your data. Isolated leaves or stems at the extremes might point to outliers, data points that deviate significantly from the rest. Learning to read these visual patterns is essential for deriving meaningful conclusions. Our dedicated pillar will walk you through Your guide to stem and leaf interpretation, ensuring you don't miss any critical insights.
The Hands-On Approach: Creating Stem and Leaf Plots Manually
Even with the convenience of generators, understanding the step-by-step process of creating a stem and leaf plot by hand deepens your comprehension of the underlying principles. This manual exercise clarifies why certain choices are made, such as selecting an appropriate "stem unit" (e.g., tens, hundreds, or even tenths) that best represents your data's range and density.
It involves carefully separating each data point, sorting the leaves in ascending order, and always remembering to include a clear key. This foundational knowledge is especially beneficial for students or anyone seeking a more intimate connection with their datasets before turning to automation. Learn the precise steps and common pitfalls to avoid by exploring our guide on Creating Stem and Leaf Plots.
Finding Its Place: Comparing Stem and Leaf Plots to Other Data Visualizations
In the vast landscape of data visualization, the stem and leaf plot holds a distinct position. While often compared to histograms, stemplots offer a unique advantage: they retain the actual data values, unlike histograms which group data into bins, losing individual details. This makes them perfect for smaller to medium datasets (typically 15-150 observations) where preserving individual data points is important.
They excel in exploratory data analysis, offering a quick, unvarnished look at distribution without the need for complex calculations. For comparing two datasets side-by-side, back-to-back stem-and-leaf plots are particularly effective. Understand the nuances of when and why you might choose this visualization over others by reading our pillar on Comparing Stem and Leaf Plots.
Organize, Understand, Excel
Stem and leaf plot generators empower you to quickly organize numerical data, reveal hidden patterns, and gain a profound understanding of your dataset's characteristics. From spotting outliers to discerning data distribution, these tools bridge the gap between raw numbers and insightful conclusions. Embrace the power of visual data analysis and let a stem and leaf plot generator be your reliable partner in exploring, interpreting, and ultimately mastering your data.