When you think about powerful tools for understanding data, your mind might leap to complex algorithms, sleek dashboards, or intricate statistical models. Yet, sometimes, the most insightful discoveries come from the simplest, most elegant methods. Enter the stem and leaf plot, an often-underestimated graphical technique that provides immediate, clear visibility into quantitative data. It’s a bit like looking at a raw data sheet but finding all the numbers neatly organized to reveal their story at a glance.
The real magic of stem and leaf plots lies in their ability to reveal the underlying structure of your data while keeping every original value intact. This isn't just a statistical curiosity from a textbook; it’s a remarkably practical tool with diverse real-world applications of stem and leaf plots, capable of unlocking practical data insights across personal finance, health, business, and even environmental science.
At a Glance: Unlocking Data with Stem and Leaf Plots
- See Every Number: Unlike histograms, stem and leaf plots preserve the original data values, giving you full transparency.
- Spot Trends Instantly: Quickly visualize the shape, spread, and central tendency of your data without complex calculations.
- Identify Outliers: Extreme values jump out, helping you investigate unusual occurrences.
- Perfect for Small Datasets: Ideal for exploring data sets with fewer than 50 observations, where individual points matter.
- Easy to Create: Can be quickly sketched by hand, making it a go-to for rapid data exploration.
- Versatile: Applicable in fields from personal budgeting to scientific research.
Why Bother with Stem and Leaf Plots? The Unsung Hero of Data Exploration
Imagine you have a list of numbers – test scores, daily temperatures, sales figures – and you want to understand them quickly. You could just stare at the list, or you could plot them. While sophisticated software can generate stunning charts, sometimes you need something immediate, something that keeps you connected to the raw numbers. That’s where the stem and leaf plot shines.
It’s a data visualization technique that simultaneously sorts your data and displays its distribution. Think of it as a hybrid between a frequency distribution table and a bar chart, offering the best of both worlds for smaller datasets. You get a clear visual representation of the data's shape—whether it's symmetric, skewed, or clustered—and you can still read off every single original data point. This transparency is invaluable when every piece of information counts, like when you're tracking your personal health metrics or analyzing a small batch of product defects. It reveals gaps, peaks, and potential outliers in a way that mere averages can't.
Anatomy of a Stem and Leaf Plot: A Quick Refresher for Action
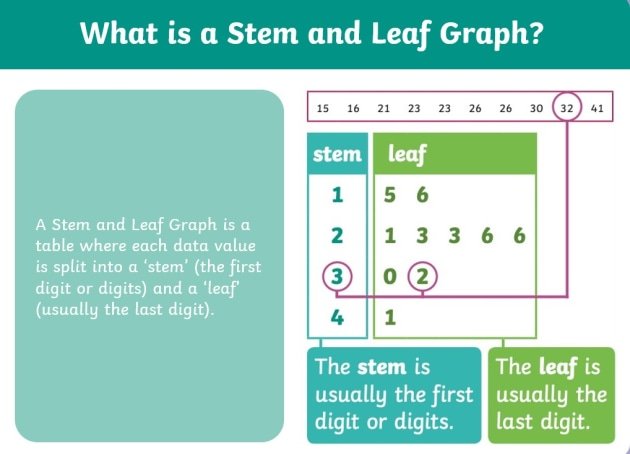
Before we dive into real-world scenarios, let’s quickly refresh the core components. A stem and leaf plot splits each data value into two parts:
- The Stem: This is typically the leading digit(s) of a number. It's listed vertically in ascending order.
- The Leaf: This is usually the trailing digit(s) of a number. Leaves are listed horizontally to the right of their corresponding stem, also in ascending order.
- The Key: Absolutely essential, the key explains how to read the plot. For example, "6 | 5 represents a score of 65." Without a key, your plot is just a collection of numbers.
Construction in a Nutshell:
- Identify Stems & Leaves: Decide which digits form the stem and which form the leaf.
- List Stems: Write stems vertically from smallest to largest.
- Add Leaves: Go through each data point and place its leaf next to its stem.
- Order Leaves: Arrange leaves for each stem from smallest to largest.
- Create a Key: Crucial for interpretation.
Interpretation Fundamentals:
Once built, a stem and leaf plot becomes a window into your data. Look at the general shape: Is it bell-shaped (symmetrical)? Does it lean to one side (skewed)? Are there any noticeable gaps or clusters? The plot immediately shows the lowest and highest values, giving you the data's range. You can also easily estimate the median (the middle value) by counting through the ordered leaves. Most importantly, any data points that stick far out from the main body of the plot—the outliers—become immediately obvious, prompting further investigation.
Real-World Application 1: Personal Finance & Budgeting – Mastering Your Money
Understanding where your money goes is the first step to financial control. Stem and leaf plots offer a straightforward way to visualize your spending habits, income fluctuations, or investment returns without needing complex budgeting software.
Scenario: Tracking your weekly grocery bills over a few months, or monitoring your daily discretionary spending (like coffee and snacks).
How it helps:
- Spotting Spending Patterns: Do your grocery bills consistently cluster around a certain amount? Are there certain weeks where spending spikes?
- Identifying Outlier Expenses: A particularly high leaf far from the others might represent an unusual purchase or a week you entertained guests. This prompts you to ask: "What happened that week?"
- Finding Areas for Savings: If many leaves fall into a higher range, it indicates a consistent spending level that could be targeted for reduction.
- Visualizing Trends: Over time, you can construct multiple plots or use back-to-back plots to see if your spending is increasing, decreasing, or staying stable.
Mini Case: Sarah's Weekly Coffee Spending (in dollars) for a Month
Let's say Sarah's daily coffee spending for the past 20 weekdays looked like this: $3.50, $4.00, $3.75, $3.50, $5.00, $4.25, $3.00, $3.50, $4.00, $4.50, $3.75, $3.25, $4.00, $3.50, $5.50, $4.75, $3.00, $4.00, $3.50, $4.00.
Choosing the whole dollar amount as the stem and the decimal as the leaf (multiplying by 10 for clarity):
Key: 3 | 0 represents $3.00
3 | 0 0 2 5 5 5 5 7 7
4 | 0 0 0 0 2 5 7
5 | 0 5
Insights for Sarah: - Her daily coffee spending mostly falls between $3.00 and $4.75.
- The most common spending amount is around $3.50 and $4.00.
- She occasionally spends $5.00 or $5.50 (outliers?), which might be days she bought coffee for a colleague or had an extra treat. These are opportunities to investigate and potentially reduce.
- The plot shows a slight skew to the higher end, indicating she spends more frequently in the $3.50-$4.00 range than below $3.50.
This quick visual provides more actionable information than just an average, allowing Sarah to see the nuances of her spending without ever touching a spreadsheet formula.
Real-World Application 2: Health & Wellness – Monitoring Your Body's Story
Whether you're managing a chronic condition, pursuing fitness goals, or simply trying to stay healthy, tracking personal health metrics is key. Stem and leaf plots offer a clear, unvarnished look at these vital numbers.
Scenario: Monitoring daily blood pressure readings, tracking sleep duration (in hours and minutes), or observing weight fluctuations over a period.
How it helps:
- Visualizing Trends: See if your blood pressure is gradually increasing, decreasing, or fluctuating wildly.
- Identifying Unusual Readings: A leaf far from the cluster (e.g., a very high or low blood sugar reading) immediately flags a potential issue that requires attention.
- Prompting Lifestyle Adjustments: If a cluster of sleep durations is consistently low, it might prompt you to prioritize better sleep hygiene.
- Patient Empowerment: For individuals managing conditions like diabetes, plotting daily blood glucose levels can make complex data easier to understand and discuss with healthcare providers.
Mini Case: A Patient's Daily Fasting Blood Glucose Levels (mg/dL) for 15 Days
Data: 95, 102, 98, 97, 105, 110, 99, 103, 96, 101, 100, 104, 98, 107, 100.
Key: 9 | 5 represents 95 mg/dL
9 | 5 6 7 8 8 9
10 | 0 0 1 2 3 4 5 7
11 | 0
Insights for the Patient: - Most readings fall between 95 and 107 mg/dL.
- The data clusters around the 90s and low 100s, indicating relatively stable levels.
- The highest reading of 110 mg/dL is a bit isolated, prompting a look at that specific day's activities or diet.
- The distribution appears relatively symmetrical, suggesting no severe upward or downward trend in this short period.
This simple plot helps both the patient and their doctor quickly grasp the typical range and identify any readings that warrant closer examination.
Real-World Application 3: Education & Performance – Understanding Student Progress
Teachers and educators constantly evaluate student performance. Stem and leaf plots provide a quick, effective way to analyze test scores, quiz results, or assignment grades, helping to identify instructional needs and individual student progress.
Scenario: A teacher analyzing the scores from a recent math quiz for their 25 students, or comparing performance on a pre-test versus a post-test.
How it helps:
- Identifying Struggling Students/Topics: A cluster of low scores is immediately visible, indicating a topic that many students found difficult or a group of students needing extra support.
- Assessing Overall Class Performance: The shape of the distribution shows if the class generally performed well, poorly, or had a wide range of scores. Is it skewed towards high scores (good understanding) or low scores (more teaching needed)?
- Comparing Cohorts: Using a back-to-back stem and leaf plot, a teacher can compare two different classes' performances on the same exam or a student's performance across different assessments.
- Revealing Outliers: Very high or very low scores that stand apart might indicate a student who needs more challenging work or one who requires significant intervention.
Mini Case: Math Quiz Scores (out of 100) for 20 Students
Data: 65, 72, 78, 80, 81, 83, 85, 85, 87, 89, 90, 91, 92, 92, 93, 95, 96, 98, 99, 100.
Key: 6 | 5 represents 65
6 | 5
7 | 2 8
8 | 0 1 3 5 5 7 9
9 | 0 1 2 2 3 5 6 8 9
10 | 0
Insights for the Teacher: - The lowest score was 65, the highest was 100.
- Most students scored in the 80s and 90s, with a strong cluster in the 90s. This suggests good overall comprehension.
- Only one student scored in the 60s, and two in the 70s. These are the students who might need targeted intervention or follow-up.
- The distribution is skewed left (towards higher scores), which is generally a positive sign for a quiz.
This plot quickly highlights areas of strength and weakness for both individual students and the class as a whole, guiding instructional decisions.
Real-World Application 4: Business & Operations – Gaining Operational Insights
In the business world, efficiency and effectiveness are paramount. Analyzing operational data—from customer service wait times to product defect rates—can pinpoint bottlenecks, improve processes, and enhance customer satisfaction. Stem and leaf plots provide a granular view of this data.
Scenario: A small e-commerce business tracking the time (in minutes) it takes to fulfill orders from placement to shipment, or a customer service department monitoring call resolution times.
How it helps:
- Optimizing Processes: If order fulfillment times cluster at a higher end, it indicates a need to streamline the shipping process.
- Identifying Bottlenecks: An outlier call time that is extremely long suggests a complex issue or a particular agent who might need more training.
- Improving Service Efficiency: Analyzing delivery durations can help set realistic customer expectations and improve logistics.
- Quality Control: Plotting the number of defects per batch can reveal if quality issues are sporadic or a persistent problem within a certain range.
Mini Case: Daily Order Fulfillment Times (in minutes) for a Small Business over 15 Days
Data: 25, 30, 28, 35, 27, 40, 32, 29, 31, 33, 26, 38, 30, 34, 36.
Key: 2 | 5 represents 25 minutes
2 | 5 6 7 8 9
3 | 0 0 1 2 3 4 5 6 8
4 | 0
Insights for the Business Owner: - Order fulfillment times range from 25 to 40 minutes.
- Most orders are fulfilled within the 20-30 minute range (five days) and 30-38 minute range (eight days), with a heavy cluster in the 30s.
- The single 40-minute fulfillment time stands out. Investigating that day might reveal a specific issue (e.g., staff shortage, technical glitch, large order) that could be prevented in the future.
- The plot shows a relatively even spread, suggesting consistent operation, but with room for improvement in bringing down the average.
By visualizing this data, the business owner can quickly identify opportunities to fine-tune their operations and ensure customer satisfaction.
Real-World Application 5: Environmental Science & Research – Observing Natural Phenomena
Scientists and researchers often deal with quantitative measurements from experiments or observations in the natural world. Stem and leaf plots can be incredibly useful for initial data exploration, helping to spot patterns before delving into more complex statistical analysis.
Scenario: A meteorologist tracking daily rainfall measurements (in millimeters) in a specific region, or a botanist observing the growth rates of plants (in centimeters) over a period.
How it helps:
- Spotting Climatic Trends: Over a month, a plot of daily temperatures can reveal if temperatures are consistently higher or lower than expected.
- Identifying Anomalies: An unusually high rainfall measurement or a sudden spike in pollutant levels would be immediately apparent, prompting investigation into the cause.
- Understanding Variability: The spread of the leaves shows the degree of variation in measurements, important for understanding natural processes.
- Comparing Conditions: Back-to-back plots can compare plant growth under different fertilizer conditions or rainfall patterns across different seasons.
Mini Case: Daily High Temperatures (in degrees Celsius) for a Month (20 days)
Data: 18, 20, 22, 19, 21, 23, 17, 20, 22, 24, 25, 20, 19, 21, 23, 26, 20, 22, 24, 25.
Key: 1 | 7 represents 17°C
1 | 7 8 9 9
2 | 0 0 0 0 1 1 2 2 2 3 3 4 4 5 5 6
Insights for the Meteorologist: - Temperatures range from 17°C to 26°C.
- Most days saw temperatures in the low 20s, with 20°C being a very common occurrence.
- The plot shows a slight skew to the higher end of the 20s, indicating warmer conditions rather than cooler ones.
- No extreme outliers were observed, suggesting a relatively stable weather pattern for the month.
This quick visual summary helps researchers confirm expected patterns or flag unexpected deviations that warrant deeper study, without losing the granular detail of each day's temperature.
Beyond the Basics: Advanced Insights and When to "Split" Your Stems
While simple, stem and leaf plots aren't static. There are ways to enhance them for deeper insights:
Splitting Stems for Granular Detail
Sometimes, your data might be too clustered around a few stems, making it hard to see the true distribution. For example, if all your test scores are between 70 and 99, a single stem for each decade (7, 8, 9) might not provide enough detail. In such cases, you can "split" each stem into two (or even five) rows.
Example of Splitting Stems (into two rows):
- One row for leaves 0-4
- Another row for leaves 5-9
Let's revisit the Math Quiz Scores data: 65, 72, 78, 80, 81, 83, 85, 85, 87, 89, 90, 91, 92, 92, 93, 95, 96, 98, 99, 100.
Original Plot:
6 | 5
7 | 2 8
8 | 0 1 3 5 5 7 9
9 | 0 1 2 2 3 5 6 8 9
10 | 0
Split Stems Plot (Key: 8* | 0 represents 80):
6* |
- | 5
7* | 2 - | 8
8* | 0 1 3 - | 5 5 7 9
9* | 0 1 2 2 3 - | 5 6 8 9
10*| 0
10.|
*represents leaves 0-4 for that stem..represents leaves 5-9 for that stem.
Notice how splitting the 80s and 90s stems gives a much clearer picture of the density within those score ranges, revealing more nuanced clusters. This technique is particularly useful when you have a moderate amount of data that would otherwise be too clumped.
Back-to-Back Stem and Leaf Plots for Comparison
When you want to compare two related datasets – like the test scores of two different classes, or a patient's blood pressure before and after medication – a back-to-back stem and leaf plot is incredibly effective. They share a central stem, with one dataset's leaves extending to the left and the other's to the right. This visual symmetry (or asymmetry) makes direct comparison intuitive.
If you're eager to try constructing your own, our stem and leaf plot generator can be a fantastic tool to get started, helping you visualize these concepts with your own data.
Stem and Leaf Plots vs. Other Visualizations: Knowing When to Choose
While powerful, stem and leaf plots aren't a one-size-fits-all solution. Knowing when to use them, and when to opt for something else, is part of becoming data literate.
When Stem and Leaf Plots Shine:
- Smaller Datasets: They are most effective with fewer than 50 observations. Beyond that, they become unwieldy.
- Preserving Original Data: When you need to see every single data point for detailed analysis, without losing any information.
- Quick & Dirty Exploration: For initial data dives, especially when you don't have access to sophisticated software or need a fast, manual plot.
- Identifying Outliers and Clusters: Their linear nature makes extreme values and concentrations of data very evident.
- Understanding Distribution Shape: Visually assessing skewness, symmetry, or uniformity is straightforward.
When Other Visualizations Might Be Better:
- Large Datasets: For hundreds or thousands of observations, histograms or box plots are far more practical and readable.
- Formal Presentations: While great for analysis, their raw nature means they aren't always the most polished choice for formal reports (though they can inform those reports).
- Detailed Frequency Counts: While they show distribution, for precise frequency counts across intervals, a histogram is often clearer.
- Comparing Many Groups: For comparing more than two groups, separate box plots or grouped bar charts might be more effective.
Common Questions & Misconceptions
As a seasoned journalist, I often encounter recurring questions about even the simplest tools. Let's tackle a few:
"Are stem and leaf plots still relevant in the age of big data?"
Absolutely. While they aren't designed for "big data" in the massive, millions-of-records sense, they remain highly relevant for the smaller, focused datasets you encounter daily in personal life, small business, classroom settings, or during the initial exploration phase of any project. Think of them as the perfect magnifying glass for a manageable handful of numbers, providing insights that might get lost in the aggregation of larger charts. Their value lies in their directness and transparency, which no complex algorithm can fully replace.
"Can they handle decimals or negative numbers?"
Yes, easily!
- Decimals: You simply choose where to split the number. For instance, if you have plant heights like 1.2, 1.5, 2.1, 2.8, 3.1:
- Stem: whole number (1, 2, 3)
- Leaf: decimal digit (2, 5, 1, 8, 1)
- Key:
1 | 2 represents 1.2 inches. - Negative Numbers: The stems just extend into the negative range. You'd list stems like -3, -2, -1, 0, 1, 2...
- Be mindful of how you order negative leaves (e.g., for stem -1, a leaf of 2 for -12 would come before a leaf of 5 for -15 if reading numerically from largest to smallest value). Conventionally, leaves are ordered from smallest absolute value to largest, or from largest negative number to smallest (e.g., -1 | 2 (for -1.2) then -1 | 5 (for -1.5) if reading from left to right as smallest leaf). The key is to be consistent and clear in your key. A common practice for negative numbers is to represent the magnitude.
Key: -1 | 2 represents -1.2.Stem -1, Leaf 2, meaning -1.2.
"Is there a 'right' way to choose stems and leaves?"
There isn't one single "right" way, but there are better ways. The goal is to create a plot that reveals the data's distribution clearly.
- Rule of Thumb: Your stems should provide enough rows to show the shape without having too many empty rows or too few rows that clump everything together. Aim for around 5-15 stems.
- Consistency: Once you decide your stem and leaf unit, stick to it. If the stem is the tens digit, it should always be the tens digit.
- Simplicity: Keep it simple. Don't make the split overly complicated. The most common approach is to use the tens digit as the stem and the units digit as the leaf. For three-digit numbers, the hundreds digit or hundreds and tens digits could be the stem.
- Context Matters: The nature of your data (e.g., very spread out vs. tightly clustered) will often dictate the most effective stem/leaf split. That's why "splitting stems" can be a useful technique when your initial choice doesn't provide enough detail.
Making the Most of Your Data: Practical Tips for Interpretation
You've built your stem and leaf plot. Now, how do you wring every last bit of insight from it?
- Always Start with the Key: Reiterate the key. Seriously. It’s the Rosetta Stone for your plot. Without it, your numbers are just numbers.
- Turn Your Head: Mentally rotate the plot 90 degrees counter-clockwise. Does it resemble a histogram? This helps visualize the shape of the distribution more clearly.
- Look for the Middle: With leaves ordered, finding the median is a simple count. This gives you a quick measure of central tendency.
- Identify the Extremes: The first leaf of the lowest stem and the last leaf of the highest stem give you the minimum and maximum values, defining your data's range.
- Scan for Gaps and Peaks: Gaps indicate ranges where no data exists, while peaks (stems with many leaves) show where data is most concentrated. What do these areas tell you about the phenomenon you're observing?
- Spot the Outliers: Any leaf that's far removed from the main body of the plot is an outlier. These are often the most interesting data points, demanding further investigation. Were they measurement errors? Truly exceptional events?
- Consider the Context: A stem and leaf plot isn't just about numbers; it's about the story those numbers tell. Relate your observations back to the real-world scenario. What does a skewed distribution of test scores imply about student learning? What does a cluster of high spending mean for your budget?
Your Next Step to Data Fluency
The stem and leaf plot might seem like a relic in an era of AI and advanced analytics, but its enduring value lies in its sheer simplicity and transparency. It offers a direct connection to your raw data, revealing patterns, outliers, and distributions without obscuring individual values.
Whether you're managing your personal finances, tracking health metrics, understanding student performance, optimizing business operations, or exploring scientific data, the insights gained from this humble plot can be profoundly practical and immediately actionable. Don't just calculate averages; visualize your data. Take the time to construct a stem and leaf plot for a small dataset you're working with. You might be surprised by the clear, practical insights that unfold right before your eyes. It’s a foundational skill for anyone looking to truly understand the numbers that shape their world.