Data, data everywhere. But how do you make sense of it all? Raw numbers can feel like a jumble of disconnected facts, leaving you scratching your head instead of nodding in understanding. That’s where powerful visualization tools come in, and the humble yet incredibly insightful stem and leaf plot is one of the best. If you've ever wrestled with a spreadsheet full of figures and wished for a clearer picture, learning How to Use a Stem and Leaf Plot Generator Effectively is your ticket to unlocking patterns, spotting outliers, and gaining immediate insights.
This isn't just about making a pretty chart; it's about telling a compelling story with your data, quickly and accurately. Whether you're a student dissecting test scores, a scientist analyzing experimental results, or a business pro tracking sales, a stem and leaf plot generator can transform daunting datasets into understandable visual summaries.
At a Glance: Your Quick Guide to Effective Stem and Leaf Plot Generation
- Purpose: Quickly visualize the distribution of numerical data while preserving original values.
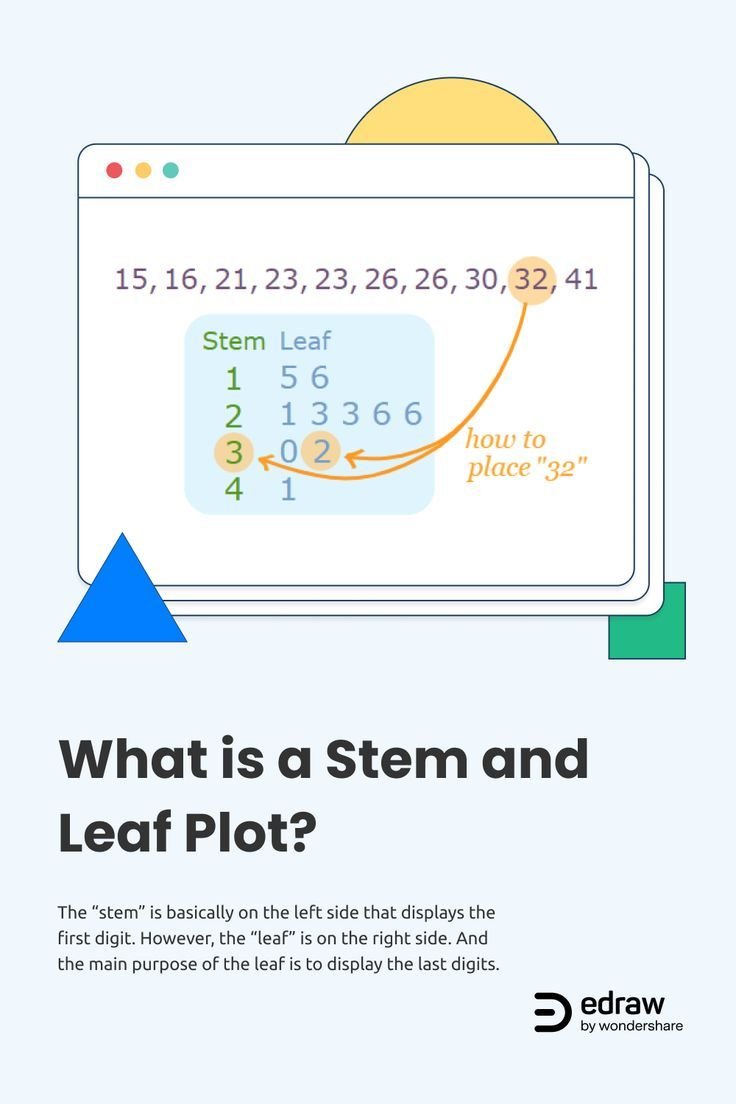
- Core Idea: Each number is split into a "stem" (leading digits) and a "leaf" (trailing digit).
- Generator Magic: Automates sorting, grouping, and display, especially for large datasets or complex decimals.
- Key Insight: Easily identify data shape, central tendency (median, mode), spread, clusters, and outliers.
- Benefit: A bridge between raw numbers and clear graphical representation.
- Next Step: Input your data, understand the plot, and interpret its story.
What Exactly Is a Stem and Leaf Plot (and Why Should You Care)?
Imagine you have a list of quiz scores from your class: 67, 73, 75, 79, 80, 83, 88, 88, 92, 95. Just looking at the numbers, it's hard to tell much beyond the highest and lowest scores. But what if you wanted to see where most students scored? Or if there were any gaps in the performance?
This is precisely the kind of question a stem and leaf plot answers with elegant simplicity. Introduced by statistician John Tukey in the 1970s as part of his groundbreaking work in exploratory data analysis (EDA), this method organizes numerical data in a unique way: it uses the actual digits of your numbers to form a visual representation of their distribution.
Unlike a histogram, which groups data into bins and loses the individual data points, a stem and leaf plot keeps every original value visible. Think of it as a hybrid: a numerical table that looks like a graph.
The Anatomy of a Stem and Leaf Plot
Every number in your dataset is broken down into two parts:
- The Stem: This typically represents the leading digit(s) of a number. For two-digit numbers like our quiz scores, the tens digit is usually the stem.
- The Leaf: This is the trailing, or last, digit of the number. For our quiz scores, the ones digit would be the leaf.
Let's take our quiz scores (67, 73, 75, 79, 80, 83, 88, 88, 92, 95) and see how they'd be plotted by hand:
- 60s: 6 | 7
- 70s: 7 | 3 5 9
- 80s: 8 | 0 3 8 8
- 90s: 9 | 2 5
When you arrange these, you get:
6 | 7
7 | 3 5 9
8 | 0 3 8 8
9 | 2 5
Suddenly, you can see patterns: most scores are in the 70s and 80s, there's a cluster at 88, and no one scored in the 60s except for one student. The shape of the data starts to emerge, almost like a sideways bar graph, without losing the granular detail of individual scores.
Why Stem and Leaf Plots Still Matter Today
In a world full of sophisticated data visualization tools, why bother with something seemingly so simple?
- Unrivaled Detail: You retain every single data point, unlike histograms which group data. This is crucial when you need to refer back to specific values.
- Instant Visual Cues: They immediately reveal the shape of your data's distribution—is it symmetric? Skewed? Clustered? Are there gaps?
- Easy to Calculate Medians and Modes: Because the data is sorted and visible, identifying the middle value (median) or the most frequent value (mode) is often a quick visual scan.
- Spotting Outliers: Anomalous data points (outliers) tend to stick out clearly at the ends of the plot, prompting further investigation.
- Compact Display: For small to moderate datasets, they offer an incredibly efficient way to summarize information.
- Educational Value: They encourage data sorting and pattern recognition, making them a staple in statistics education.
Beyond the Basics: How a Stem and Leaf Plot Generator Simplifies Your Life
While creating a stem and leaf plot by hand is a great learning exercise, it quickly becomes tedious and prone to errors with larger datasets or complex numbers. Imagine trying to plot hundreds of daily stock prices or scientific measurements, each with multiple decimal places!
This is where a dedicated stem and leaf plot generator becomes an indispensable ally. It takes the heavy lifting off your shoulders, offering speed, accuracy, and convenience that manual plotting simply can't match.
Here’s why you'll want to use a generator:
- Blazing Speed: Instantly generate plots for datasets that would take hours to process by hand.
- Flawless Accuracy: Eliminates human error in sorting, grouping, and transcribing numbers.
- Handles Complexity with Ease: No more headaches with decimals or very large numbers; the generator automatically scales and organizes them. For instance, if you have 12.3 and 12.8, the generator might use '12' as the stem and '3' and '8' as the leaves, adapting its logic to display the most relevant digit as the leaf.
- Accessibility: Most generators are web-based, meaning you can access them from anywhere, on any device.
- Focus on Interpretation: By automating the creation, you can dedicate your energy to understanding what the data is telling you, rather than on the mechanics of plotting.
Ready to put one to the test? You can Use our stem and leaf plot generator to experience these benefits firsthand.
Your Step-by-Step Guide to Using a Stem and Leaf Plot Generator Effectively
Using a stem and leaf plot generator is typically a straightforward process, designed for user-friendliness. Here’s how to navigate it for optimal results:
Step 1: Prepare Your Data
The most crucial step happens before you even touch the generator: your data needs to be clean and organized.
- Format: Most generators expect your data as a series of numbers, typically separated by commas. Some might accept spaces or new lines, but comma-separated is the most common and reliable format.
- Example Input:
10, 12, 15, 18, 20, 22, 25, 28, 30, 31, 35, 38 - Consistency: Ensure all numbers are in the same unit and represent the same type of measurement.
- Outliers Check (Preliminary): While the plot itself helps spot outliers, a quick scan for obvious data entry errors beforehand can save you time.
Step 2: Input Your Data into the Generator
Locate the input field on the generator's interface. It's usually a large text box.
- Copy and Paste: The easiest method is to copy your comma-separated data from a spreadsheet or text file and paste it directly into the input box.
- Manual Entry: For smaller datasets, you can type the numbers manually, ensuring you use the correct separator (e.g., a comma) between each value.
Step 3: Understand Decimal Handling (If Applicable)
One of the generator's clever features is its ability to manage decimal numbers, which can be tricky to plot manually.
- The "Multiply by Ten and Round" Rule: As per standard practice, many generators handle decimals by effectively "shifting" the decimal point. For example, if you input
12.3, 12.8, 13.1, the generator might:
- Multiply each number by ten:
123, 128, 131. - Use the integer part (e.g.,
12from123) as the stem. - Use the first decimal place (e.g.,
3from123) as the leaf.
- This results in:
- 12 | 3 8
- 13 | 1
- Always check the generator's key or explanation: Some generators might have options for how many decimal places to include in the stem or leaf, or how to scale very small/large numbers. Make sure you understand its specific methodology.
Step 4: Generate the Plot
Once your data is entered and you've understood any specific input requirements (like decimal handling), simply click the "Generate Plot" or similar button.
The generator will:
- Sort the Data: Arrange all your numbers in ascending order.
- Determine Stems: Based on the values, it will identify the appropriate leading digits for the stems.
- Extract Leaves: It will then pull the trailing digit(s) to form the leaves for each corresponding stem.
- Display the Plot: Present the organized stem and leaf plot, often with a key explaining how to read the stems and leaves (e.g., "Stem: 10s digit, Leaf: 1s digit" or "12 | 3 = 12.3").
Cracking the Code: How to Read and Interpret Your Stem and Leaf Plot
Generating the plot is only half the battle; the real value comes from interpreting it. Here’s how to make sense of the visual story your data is telling:
Reading the Stems and Leaves
This might seem obvious, but it's crucial to understand the scaling.
- The Key is Key: Always look for a key provided by the generator. It might say something like "6 | 7 = 67" or "12 | 3 = 12.3". This tells you exactly what each stem and leaf combination represents.
- Stems as Categories: Each stem represents a specific numerical interval or category. The length of the row of leaves next to a stem shows the frequency of data points in that interval.
- Leaves as Individual Values: Each leaf is an individual data point. The order of leaves (usually sorted numerically) within a stem group can also provide quick insights into clustering.
Identifying the Distribution Shape
One of the most powerful aspects of a stem and leaf plot is its ability to reveal the shape of your data's distribution at a glance. Imagine turning the plot on its side, so the stems form a vertical axis and the leaves extend horizontally.
- Symmetric Distribution: If the plot looks roughly balanced on both sides of a central point, it suggests a symmetric distribution (like a bell curve).
- Skewed Right (Positively Skewed): If the "tail" of the data extends longer to the right (higher values), it's positively skewed. This means most values are clustered on the lower end, with fewer, higher values pulling the mean up.
- Skewed Left (Negatively Skewed): If the "tail" extends longer to the left (lower values), it's negatively skewed. Most values are clustered on the higher end, with fewer, lower values pulling the mean down.
- Uniform Distribution: If all stems have roughly the same number of leaves, it suggests data is evenly distributed across its range.
- Bimodal Distribution: If you see two distinct peaks or clusters in the leaves, it could indicate two different groups or patterns within your data.
Finding the Median, Mode, and Range
The ordered nature of the stem and leaf plot makes these common statistical measures particularly easy to identify:
- Median: This is the middle value of your dataset. Since the leaves are sorted in ascending order, simply count from either end of the plot until you reach the middle data point. If there's an even number of data points, it's the average of the two middle values.
- Mode: The mode is the value that appears most frequently. On a stem and leaf plot, this will be the leaf (or stem-leaf combination) that repeats most often. In our quiz example (8 | 0 3 8 8), 88 is the mode.
- Range: This is the difference between the highest and lowest values. Identify the smallest leaf on the smallest stem and the largest leaf on the largest stem, then subtract the former from the latter.
Spotting Outliers and Gaps
- Outliers: Data points that are significantly different from the rest of the dataset will clearly stand out as individual leaves far from the main body of the plot. These deserve further investigation—are they errors, or truly unusual occurrences?
- Gaps: Empty stems or significant breaks between groups of leaves indicate gaps in your data, showing that no values occurred in certain ranges. This can be just as informative as clusters.
The Power of Perspective: Using Stem and Leaf Plots for Deeper Insights
Stem and leaf plots aren't just academic exercises; they have practical applications across numerous fields. They help bridge the gap between abstract numbers and tangible understanding, often serving as a preliminary step to more complex analyses.
Real-World Applications
- Education: Teachers use them to analyze test scores, understand student performance distribution, and identify areas where students might be struggling or excelling. (Think back to our quiz score example!)
- Science and Research: Scientists plot experimental data (e.g., plant growth, reaction times, pollutant levels) to quickly assess variability, identify patterns, and spot unusual readings before conducting more rigorous statistical tests.
- Business and Finance: Analysts can plot daily sales figures, customer wait times, or even stock price changes over a short period to gauge consistency, identify peak periods, or spot unusual market movements. While they might use more complex tools for how to calculate standard deviation for investment risk, a stem and leaf plot can provide a quick visual intuition of data spread and clusters.
- Sports Analytics: Coaches can plot player statistics (e.g., points scored, race times) to compare individual performance, track improvement, or identify potential areas for training focus.
- Weather Forecasting: Meteorologists might plot daily temperatures over a month to visualize temperature ranges, typical fluctuations, and identify unusual heat waves or cold snaps.
Connecting to Other Statistical Concepts
A stem and leaf plot is often a precursor or a complementary tool to other statistical analyses:
- Relationship to Histograms: While different, they both show frequency distributions. A stem and leaf plot can be seen as a histogram where the 'bars' are made of numbers, preserving detail.
- Building Block for Box Plots: Understanding the distribution, median, and potential outliers from a stem and leaf plot naturally leads into creating a box plot, which provides a five-number summary (minimum, first quartile, median, third quartile, maximum) and visually highlights outliers.
- Visualizing Variability before Standard Deviation: Before you calculate the standard deviation – a key measure of data spread – a stem and leaf plot gives you an immediate visual sense of that spread. If the leaves are tightly clustered around a central stem, you'd anticipate a low standard deviation, indicating consistency. Conversely, if leaves are spread out across many stems, you'd expect a higher standard deviation, reflecting greater variability. This visual intuition is vital for truly understanding what the calculated standard deviation means in context. Understanding how to calculate standard deviation is easier when you first visualize the data spread.
- Detecting Normality (or lack thereof): By observing the shape of the distribution, you can get a preliminary idea of whether your data might approximate a normal distribution, which is an assumption for many advanced statistical tests. If your stem and leaf plot shows clear skewness or multiple peaks, you know to be cautious about applying tests that assume normality.
Maximizing Your Generator: Best Practices and Pro Tips
Getting the most out of your stem and leaf plot generator goes beyond just inputting numbers. Here are some expert tips:
1. Always Verify the Key and Scaling
Especially with decimals or very large/small numbers, confirm how the generator has defined its stems and leaves. A key like "12 | 3 = 12.3" is critical. If you're working with numbers like 1230, the stem might be '12' and the leaf '3', implying 123.0 (with a mental note of an implied multiplier of 10 for the entire plot). Misinterpreting the scaling will lead to incorrect conclusions.
2. Consider Your Data's Context for Stem Unit Selection
While generators typically make smart default choices, for extremely wide-ranging data, you might sometimes want to adjust the "granularity" if the generator offers options.
- Too Many Stems: If your plot has very few leaves per stem (e.g., only one or two), your stems might be too specific. This can happen with very spread-out data.
- Too Few Stems: If you have many leaves crammed into just a few stems, your stems might be too broad, obscuring finer details of the distribution.
- For Large Numbers: If your data points are, say, 10,000, 10,200, 10,500, the generator might use '10' as the stem and '0' '2' '5' as the leaves (implying '00' at the end). Always refer to the key! Sometimes, a stem might represent the thousands, and a leaf the hundreds digit.
- For Small Decimals: If your data is 0.12, 0.15, 0.18, the stem might be '0.1' and the leaves '2', '5', '8'.
3. Use Back-to-Back Plots for Comparison
If you're comparing two related datasets (e.g., pre-test vs. post-test scores, or performance of two different groups), a back-to-back stem and leaf plot is incredibly insightful.
- This involves a central stem column, with one dataset's leaves extending to the left and the other's to the right.
- This visual arrangement allows for direct comparison of distributions, spread, and central tendencies between the two groups. Some advanced generators might offer this feature, or you might have to create two separate plots and visualize them side-by-side.
4. Don't Overlook the "Empty" Stems
An empty stem (a stem with no leaves) isn't a flaw; it's data. It indicates a gap in your data range, which can be just as significant as a cluster. It tells you that no observations fell within that particular numerical interval.
5. Always Accompany Your Plot with Narrative
A stem and leaf plot is a powerful visual, but it doesn't speak for itself entirely. Always add a concise explanation or narrative that highlights what you've observed:
- "The data appears to be slightly skewed to the right, indicating most values are lower."
- "There's a clear outlier at 155, which warrants further investigation."
- "The median value is 83, showing the central tendency of the scores."
- "A significant gap exists between 50 and 60, suggesting no data points were recorded in this range."
Common Questions About Stem and Leaf Plot Generators
When should I use a stem and leaf plot versus a histogram?
Use a stem and leaf plot when:
- You have a small to moderate dataset (typically under 100 data points).
- You need to retain all original data values.
- You want to quickly identify the median, mode, and range.
- You're in the exploratory data analysis phase and want a detailed view.
Use a histogram when: - You have a very large dataset where individual values aren't as critical.
- You want a more generalized view of the distribution shape.
- You need to compare the overall shape of distributions (e.g., normal, skewed).
- You're presenting to an audience who might find the digit-by-digit approach too granular.
Can stem and leaf plot generators handle negative numbers?
Yes, most modern generators can handle negative numbers. The stem would typically include the negative sign. For example, -12 | 3 could represent -12.3. However, data with both positive and negative numbers can sometimes look less intuitive, so ensure the key is very clear.
What about very large or very small decimal numbers?
Generators often use scaling factors for such data. For instance, if your data is in the millions (e.g., 12,300,000), the generator might treat the '12' as the stem and '3' as the leaf, implying a scaling factor of 1,000,000. For very small decimals (e.g., 0.0012), it might multiply by a large power of 10 to bring it into a manageable integer-like form, then define the stem and leaf accordingly. Always check the provided key or explanation for these situations.
Are they truly "accurate" for all data types?
Stem and leaf plots are excellent for numerical, quantitative data. They are not suitable for categorical data (e.g., colors, types of cars) or qualitative data. For numerical data, as long as the generator's scaling and key are understood, they are highly accurate in their representation. Their limitation lies more in their aesthetic for very large datasets or their ability to convey a smoothed distribution compared to a curve.
Putting Your Data Story in Motion
The ability to use a stem and leaf plot generator effectively is a valuable skill in your data analysis toolkit. It empowers you to move beyond simply looking at numbers to truly seeing and understanding them. By harnessing the power of these intuitive plots, you're not just organizing data; you're uncovering its hidden stories—its strengths, its weaknesses, its outliers, and its patterns.
So, the next time you're faced with a jumble of numbers, remember that clarity is just a few clicks away. Input your data, generate your plot, and start interpreting the insights that emerge. You'll be amazed at how quickly you can transform raw figures into actionable knowledge, giving you a competitive edge whether in the classroom, the lab, or the boardroom.