Choosing the right visual aid to tell your data's story can feel like navigating a maze. You've got raw numbers, but how do you make them sing? When it comes to comparing Stem and Leaf Plots to other data visualizations, understanding their unique strengths and weaknesses is key. These aren't just obscure tools from a statistics textbook; they're powerful, intuitive ways to get a quick, accurate read on your data's distribution, especially for smaller datasets where every individual data point matters.
This guide will cut through the noise, showing you exactly where stem-and-leaf plots fit into your data analysis toolkit, how they stack up against other common charts like dot plots, histograms, and box plots, and when they're undeniably your best choice.
At a Glance: Key Takeaways
- Stem-and-Leaf plots and Dot plots are excellent for visualizing univariate data from small to moderate datasets (typically under 100 observations).
- Both preserve individual data values, allowing you to see the exact numbers behind the distribution.
- Stem-and-leaf plots offer a structured, sorted view that makes calculating the median and identifying outliers straightforward. They combine aspects of a table and a histogram.
- Dot plots are simpler to construct and excellent for direct comparison between groups or categories on the same axis.
- For larger datasets or complex multivariate relationships, other visualizations like histograms, box plots, and scatter plots often become more practical and powerful.
- The best visualization always depends on your data's characteristics, your analytical goals, and your audience.
The Unsung Heroes: Stem-and-Leaf Plots & Dot Plots
Before we dive into direct comparisons, let's get reacquainted with two simple yet profound methods for visualizing univariate data: the stem-and-leaf plot and the dot plot. They might seem humble next to flashy dashboards, but their clarity and data-preserving nature make them indispensable for initial data exploration.
Stem-and-Leaf Plots: A Closer Look
Imagine wanting to see the shape of your data distribution while still being able to reconstruct every single data point. That's the core magic of a stem-and-leaf plot. It's a clever hybrid, part table and part histogram, that organizes numerical data based on its digits.
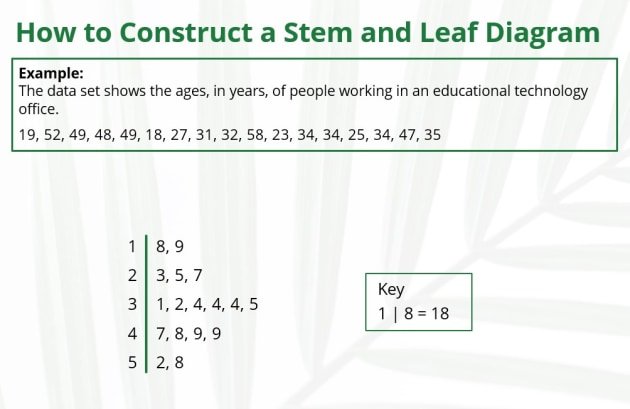
The "stem" typically represents the leading digit(s) of your data values (e.g., tens place), while the "leaf" represents the trailing digit(s) (e.g., ones place). This structure creates a visual bar for each stem, similar to a histogram, but with the actual data values embedded within.
Advantages: Why You'd Pick One
- Preserves Original Data: Unlike histograms, which group data into bins and lose individual values, a stem-and-leaf plot keeps every single data point visible. You can always reconstruct the original dataset directly from the plot.
- Reveals Distribution Shape: At a glance, you can see if your data is symmetric, skewed, bimodal, or has any unusual peaks or gaps. This is crucial for understanding the underlying patterns.
- Easy to Construct (Manually): For smaller datasets, you can often sketch one out by hand quickly, making it a great tool for on-the-fly analysis or classroom settings.
- Identifies Outliers Instantly: Extreme values tend to stand out as isolated leaves or stems far from the main body of data.
- Aids in Summary Statistics: Because the leaves are typically ordered, finding the median is simplified. The mode is also often easy to spot by looking for the most frequent leaf within a stem.
- Effective for Smaller Datasets: They truly shine with 15-50 observations, though they can extend to 100 before becoming too cumbersome. For example, if you're analyzing the test scores of a single class, a stem-and-leaf plot provides a wonderfully detailed overview. In fact, you can easily create one for your specific data using our stem and leaf plot generator.
Building Your Own Stem-and-Leaf Plot: A Quick Guide
The process is surprisingly straightforward, turning a jumble of numbers into a clear visual.
- Identify Stems: Look at your data range. If your numbers are mostly two-digit (e.g., 65, 72, 88), the tens digits will be your stems. If they're three-digit (e.g., 125, 131), the first two digits might form your stems.
- List Stems: Write these stems vertically, from smallest to largest, with a vertical line to their right.
- Add Leaves: Go through each data point. Take its trailing digit (the leaf) and place it next to its corresponding stem. For example, if your data point is 65, and '6' is the stem, place '5' as the leaf.
- Order Leaves (Strongly Recommended): For maximum clarity and ease of interpretation, arrange the leaves for each stem in ascending order from left to right.
- Include a Key: This is non-negotiable! A key explains how to read your plot (e.g., "6 | 5 represents a score of 65").
Decoding the Data: Interpreting a Stem-and-Leaf Plot
Once your plot is built, it's time to read its story:
- Distribution Shape: Tilt your head to the left. Does it look like a bell curve (symmetric), or is it stretched to one side (skewed)? Are there two distinct peaks (bimodal)?
- Range: The smallest leaf on the smallest stem and the largest leaf on the largest stem define your data's full spread.
- Central Tendency: The median is the middle value; with ordered leaves, you can count in from both ends to find it. The mode is simply the leaf that appears most frequently on any given stem.
- Outliers: Look for any lone leaves that are far removed from the rest of the data. They might indicate errors or unusual observations.
- Clusters/Gaps: Notice where leaves are densely packed (clusters) or where there are empty spaces (gaps). This can reveal subgroups or ranges where no data exists.
Beyond the Basics: Variations and Tricks
- Decimals: Handling decimals is easy. If you have data like 1.2, 1.5, 2.1, the whole number (1, 2) can be the stem, and the decimal part (2, 5, 1) becomes the leaf. Your key would specify "1 | 2 represents 1.2 inches."
- Splitting Stems: If your data is heavily clustered around a few stem values, splitting them can offer more detail. For example, you might create one row for "6" for leaves 0-4 and another row for "6" for leaves 5-9. This effectively doubles the number of "bins," spreading out the data for a clearer view.
When They Fall Short: Disadvantages
- Not for Large Datasets: Try making a stem-and-leaf plot for 500 data points. It quickly becomes an unreadable mess, sprawling across the page.
- Subjectivity in Construction: The choice of what constitutes a "stem" and a "leaf" isn't always clear-cut, especially with varied data ranges, leading to different visual representations of the same data.
- Less Common in Professional Software: While powerful, specialized statistical software often defaults to other visualizations like histograms or box plots, making stem-and-leaf plots feel less "mainstream" in some professional contexts.
Dot Plots: Simple, Direct, Powerful
Dot plots, also known as strip plots or line plots, offer an even more direct way to visualize univariate data. They display each individual data point as a dot or symbol along a single numerical axis. When multiple data points share the same value, their dots are stacked vertically, creating a visual representation of frequency.
The Core Concept: What a Dot Plot Does
At its heart, a dot plot provides a literal "picture" of your data's distribution. Each dot is a raw observation. By seeing where the dots cluster and where they thin out, you gain immediate insights into the data's range, density, and any unusual values.
Where Dot Plots Shine: Key Applications
- Visualizing Single Variable Distribution: Perfect for showing the spread of heights, test scores, waiting times, or any other single numerical variable. You can quickly identify peaks, valleys, and the overall shape.
- Comparing Distributions of Groups: This is where dot plots truly excel. By placing dots for different groups (e.g., male vs. female test scores) along the same axis, you can make direct, intuitive comparisons of their distributions, ranges, and central tendencies.
- Illustrating Categorical vs. Numerical Relationships: When you have a categorical variable and want to see how a numerical variable distributes within each category, a dot plot is a clean and effective choice.
- Supplementing Statistical Measures: Dot plots are often used alongside mean, median, mode, range, and interquartile range, providing the visual context for these summary statistics.
Creating a Clear Dot Plot: Steps
- Determine Scale: Draw a horizontal axis (or vertical, if preferred) that covers the entire range of your data. Ensure the intervals are evenly spaced and clearly labeled.
- Position Dots: For each data point, place a dot directly above its value on the axis.
- Stack for Frequency: If multiple data points have the exact same value, stack their dots directly on top of each other. This vertical stacking visually indicates frequency.
Making Your Dot Plots Speak: Customization Tips
Effective communication with dot plots goes beyond basic construction. A few tweaks can significantly enhance interpretability:
- Distinguish Categories: When comparing groups, use different colors, shapes, or even slightly offset positions for the dots of each category.
- Enhance Visually: Adjust dot size for clarity, add labels to specific points of interest, or annotate outliers.
- Provide Context: A meaningful title and clear axis labels are essential for understanding.
- Highlight Patterns: Use shading or different colors to draw attention to clusters, gaps, or outliers.
- Optimize Arrangement: Ensure dots are spaced well enough to be distinguishable, but close enough to show density.
- Maintain Consistency: If comparing multiple plots, use the same scale and axis for accurate visual comparisons.
- Legend: Always include a legend if using different colors or symbols.
Head-to-Head: Stem-and-Leaf vs. Dot Plots
Both stem-and-leaf plots and dot plots are champions of univariate data visualization for small datasets. They share the core advantage of preserving individual data values. However, their subtle differences lead to different optimal use cases.
Similarities and Key Distinctions
| Feature | Stem-and-Leaf Plot | Dot Plot |
|---|---|---|
| Data Preservation | Yes (shows actual digits) | Yes (each dot is an individual data point) |
| Data Type | Univariate numerical | Univariate numerical |
| Dataset Size | Small to moderate (15-100) | Small to moderate (15-100) |
| Construction | Groups by leading digits (stems), trailing digits (leaves) | Plots individual points along an axis, stacks for frequency |
| Ordering | Leaves are typically ordered automatically | Dots are inherently ordered by their position on the axis |
| Shape Visibility | Excellent (tilt to see histogram-like shape) | Excellent (density of dots reveals shape) |
| Outlier Detection | Very easy (isolated leaves/stems) | Very easy (isolated dots) |
| Median/Mode Ease | Easy to estimate/calculate (due to ordering) | Easy to estimate mode (tallest stack); median requires counting |
| Comparison Between Groups | Possible with back-to-back plots, but less intuitive | Excellent (different colors/symbols on same axis) |
| Decimal Handling | Explicitly handled via key | Handled naturally by axis scale |
| Manual Creation | Relatively easy, more structured | Very easy, more free-form |
When One Outshines the Other
- Choose a Stem-and-Leaf Plot when:
- You absolutely need to see the exact numerical values that make up the distribution, perhaps for quick calculations of median or identifying specific data points.
- Your dataset is small, and you want a quick, detailed overview without losing any information.
- You need to quickly sort data as part of your visualization process.
- You're primarily interested in the shape of a single distribution and its raw values.
- Choose a Dot Plot when:
- Your primary goal is to compare the distributions of two or more groups on a single visual. The shared axis makes this incredibly intuitive.
- You want a very clean, straightforward representation of frequency without the digit-based structure of a stem-and-leaf.
- Your data includes decimals or has a wide range where a digit-based stem might become less clear.
- You value simplicity and directness in presenting individual data points.
Stepping Up the Ladder: Comparing Stem-and-Leaf Plots to Other Data Visualizations
While stem-and-leaf and dot plots are excellent for small, univariate datasets, the world of data visualization offers many more sophisticated tools. Understanding their trade-offs is crucial for picking the right chart for the job.
Stem-and-Leaf vs. Histograms: The Grouping Game
This is perhaps the most common comparison, as they both aim to show the distribution of a single numerical variable.
- Histograms: These plots use bars to represent the frequency of data points falling within defined "bins" or intervals.
- Advantages: Excellent for large datasets where individual values are less critical. They quickly convey the overall shape, central tendency, and spread. Widely understood and professionally accepted.
- Disadvantages: Lose individual data values (data is aggregated into bins). The choice of bin width can significantly alter the appearance of the distribution, which can be misleading if not chosen carefully.
- When to prefer a Histogram: For large datasets (hundreds or thousands of points), when precise individual values aren't necessary, or when you need a broadly understood, polished visualization for presentations.
- Stem-and-Leaf Plots: As discussed, they preserve individual data points and effectively serve as a raw data table and a histogram rolled into one.
- When to prefer a Stem-and-Leaf Plot: For smaller datasets where retaining individual data values is paramount, or when you need a quick, informal display that also sorts the data.
Key Difference: Histograms are about binning and frequency; stem-and-leaf plots are about preserving digits and frequency.
Stem-and-Leaf vs. Box Plots: Summarizing vs. Detail
These two visualizations offer very different perspectives on data distribution.
- Box Plots (Box-and-Whisker Plots): These plots provide a five-number summary (minimum, first quartile, median, third quartile, maximum) of the distribution, along with potential outliers. They are compact and highly effective for comparing distributions across multiple groups.
- Advantages: Excellent for quickly visualizing central tendency, spread, and skewness, and especially powerful for comparing distributions of several groups side-by-side. Robust against outliers in terms of overall shape.
- Disadvantages: They do not show individual data points, making it impossible to reconstruct the original data. The internal structure of the distribution (e.g., bimodality) is often hidden.
- When to prefer a Box Plot: When you need a concise summary of distribution for one or many groups, or when comparing key summary statistics (median, quartiles) is your main goal.
- Stem-and-Leaf Plots: Offer granular detail, showing every single data point and the actual shape of the distribution, including any internal clusters or gaps.
- When to prefer a Stem-and-Leaf Plot: When you need to see the exact values and the complete shape of the distribution, including any quirks like bimodality, for a single, small dataset.
Key Difference: Box plots offer a summary; stem-and-leaf plots offer detail and raw data.
Stem-and-Leaf vs. Scatter Plots: Univariate vs. Multivariate
This comparison highlights a fundamental difference in the type of data they visualize.
- Scatter Plots: These plots are used to display the relationship between two numerical variables (bivariate data). Each point on the plot represents a pair of values (x, y).
- Advantages: Superb for identifying correlations, trends, clusters, and outliers in relationships between variables.
- Disadvantages: Not designed for visualizing the distribution of a single variable. Cannot easily handle more than two or three variables effectively without advanced techniques.
- When to prefer a Scatter Plot: When your goal is to explore or illustrate the relationship between two numerical variables (e.g., height vs. weight, advertising spend vs. sales).
- Stem-and-Leaf Plots: Strictly for visualizing the distribution of a single numerical variable (univariate data).
- When to prefer a Stem-and-Leaf Plot: When your focus is solely on understanding the spread, shape, and individual values of one variable.
Key Difference: Stem-and-leaf plots are for one variable; scatter plots are for two or more variables and their relationships.
Other Considerations
- Bar Charts/Pie Charts: These are generally for categorical data, showing frequencies or proportions of different categories. While you could count frequencies from a stem-and-leaf plot and then make a bar chart, they serve different initial purposes.
- Time Series Plots: Used for data collected over time, showing trends and patterns over sequential periods. Not directly comparable to stem-and-leaf plots which are static snapshots of a single variable.
Choosing Your Weapon: Decision Criteria for Data Visualization
With so many options, how do you decide which visualization is best? It boils down to a few critical questions.
Dataset Size and Complexity
- Small to Moderate (under 100 observations): Stem-and-leaf plots and dot plots are excellent. They preserve individual data values, offering maximum detail. This is invaluable for small studies or classroom examples.
- Large (hundreds to thousands): Histograms, box plots, and density plots become more practical. The sheer volume of data makes individual point displays unwieldy. Aggregating data into bins or summaries is necessary for clarity.
- Multivariate (two or more variables): Scatter plots are your go-to for showing relationships between two numerical variables. For more complex multivariate data, you might look at heatmaps, parallel coordinate plots, or more advanced statistical graphics.
The Story You Need to Tell
- "What's the precise distribution of these raw scores, and what are the exact values?" -> Stem-and-leaf plot.
- "How do the distributions of these two groups compare, point by point?" -> Dot plot.
- "What's the overall shape and spread of this large dataset?" -> Histogram.
- "What's the summary of the central tendency, spread, and outliers for this data (or across groups)?" -> Box plot.
- "Is there a relationship between X and Y?" -> Scatter plot.
Audience and Context
- Technical Audience (Statisticians, Data Scientists): They can interpret a wider range of plots, including specialized ones. They appreciate the detail of stem-and-leaf plots for initial data sanity checks.
- General Audience (Executives, Non-technical Stakeholders): Simplicity and immediate interpretability are key. Histograms, clean dot plots, and box plots (with proper explanation) are often better received than highly detailed stem-and-leaf plots, which can appear too "raw" or academic.
- Exploratory Analysis (for yourself): You might start with a stem-and-leaf plot or dot plot to get a feel for the raw data, then move to a histogram or box plot as you refine your insights.
- Formal Presentation: Often calls for more polished, aggregated plots that highlight key findings without overwhelming the audience with too much raw detail.
Common Questions & Misconceptions
Let's clear up some lingering doubts about these powerful visualization tools.
Are stem-and-leaf plots still relevant in the age of advanced software?
Absolutely! While less common in automated business intelligence dashboards, they remain incredibly relevant for:
- Exploratory Data Analysis (EDA): When you're first getting to know a small dataset, a stem-and-leaf plot provides an unparalleled level of detail and transparency. You see every number.
- Teaching and Learning: They are fantastic for students to grasp fundamental concepts of data distribution, frequency, and summary statistics without abstracting the data too much.
- Small-Scale Studies: In fields like medicine, psychology, or education, where sample sizes might be small, they offer a quick, robust overview.
Can I use stem-and-leaf plots for categorical data?
No. Stem-and-leaf plots are strictly for numerical data. Categorical data (like colors, types of cars, yes/no answers) should be visualized with bar charts, pie charts, or frequency tables. Trying to force categorical data into a stem-and-leaf plot wouldn't make sense digit-wise and wouldn't reveal any meaningful distribution.
What's the biggest mistake people make when using stem-and-leaf plots or dot plots?
The most common mistake is trying to apply them to datasets that are too large. While tempting to preserve every data point, a plot with hundreds of stems and thousands of leaves (or dots) becomes unreadable noise. For such cases, aggregation via histograms or summary via box plots is essential. Another mistake is forgetting the key for a stem-and-leaf plot, rendering it indecipherable to anyone else.
How do they handle outliers differently?
Both are excellent for identifying outliers because they show individual data points.
- Stem-and-leaf plots: Outliers are clearly isolated leaves or stems, making it easy to see their exact value and how far they are from the main body.
- Dot plots: Outliers appear as single dots far removed from the main cluster of dots. This visual isolation is equally effective.
Are there any tools for creating these plots easily?
Many statistical software packages (R, Python with libraries like Matplotlib/Seaborn) can generate dot plots and sometimes stem-and-leaf plots. Excel can be coaxed into making approximations, though it's not ideal. For quick, manual construction or basic needs, pen and paper (or a simple online generator) are often sufficient, especially for learning.
Beyond the Charts: Mastering Data Storytelling
Ultimately, choosing between a stem-and-leaf plot, a dot plot, or any other visualization isn't about finding the "most advanced" option. It's about finding the most effective one for your specific data, question, and audience. Stem-and-leaf plots and dot plots, despite their simplicity, offer an unparalleled level of transparency and detail for smaller datasets, allowing you to connect directly with the raw numbers.
They remind us that sometimes, the most powerful insights come from keeping things clear, simple, and direct. So, the next time you're faced with a small batch of numbers, don't overlook these unsung heroes of data visualization. They might just tell you the story you needed to hear, in a way no other chart could.