When you’re staring down a raw dataset, trying to make sense of its patterns, a basic stem-and-leaf plot is often your first, best friend. It’s like peeking behind the curtain to see every individual data point while still getting a quick feel for the overall distribution. But what happens when that curtain is a sprawling tapestry of hundreds of values, or when the data hides subtle nuances that a simple plot just can't reveal? That's where the advanced features and customization in stem and leaf generators truly shine, transforming a humble visual into a powerful diagnostic tool.
These sophisticated generators move beyond static, one-size-fits-all plots. They empower you to manipulate how data is grouped, displayed, and interpreted, helping you unlock deeper insights that would otherwise remain hidden.
At a Glance: What Advanced Generators Bring to Your Data Analysis
- Handle Massive Datasets: No more clutter; group data intelligently for clarity.
- Reveal Finer Detail: Split stems and precise decimal handling expose hidden patterns.
- Uncover Complex Distributions: Clearly illustrate multimodal or skewed data.
- Integrate with Other Tools: Combine with histograms and box plots for a comprehensive view.
- Quantify Variability: Understand data spread using metrics like standard deviation.
- Enhance Presentation: Create clear, annotated, and audience-tailored visuals.
Beyond the Basics: Why Standard Plots Miss the Mark
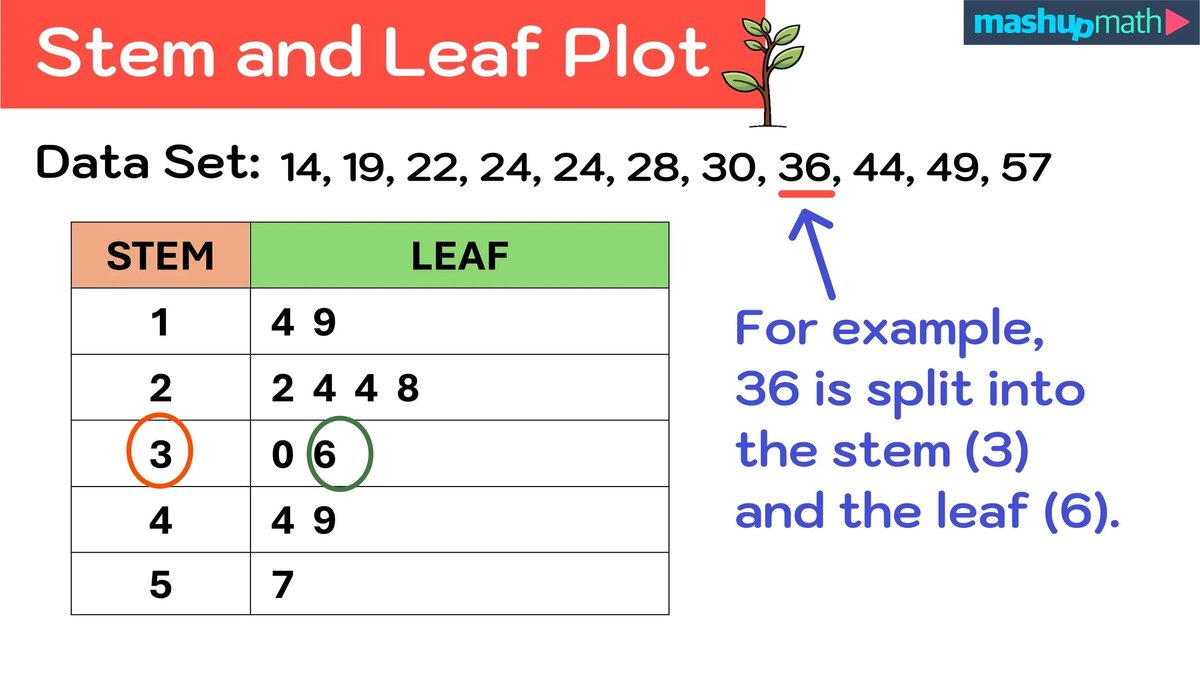
A traditional stem-and-leaf plot provides a fantastic snapshot: it retains every single data point, organizes them by magnitude, and gives you an immediate sense of central tendency and spread. You can quickly see if your data is clustered or spread out, symmetrical or skewed.
However, its simplicity becomes a limitation when dealing with real-world complexities:
- Extensive Datasets: Imagine plotting 500 exam scores (0-100) on a single, unadjusted stem-and-leaf. You'd end up with a wall of numbers, making it impossible to spot meaningful patterns. The "leaves" would simply overwhelm the "stems."
- Decimal or Fractional Data: If your data involves precise measurements like reaction times (e.g., 0.47 seconds), a basic plot might either force heavy rounding, losing crucial distinctions, or create overly long, unwieldy stems.
- Complex Distributions: What if your data has two or three distinct peaks (multimodal)? A standard plot might show a general hump, but it won't clearly differentiate the underlying groups or processes.
- Tied Values: When many data points share the same stem and leaf value, it can create visual clutter without necessarily highlighting their frequency effectively.
This is precisely where advanced features in modern stem and leaf generators step in, offering the precision and flexibility needed to turn raw data into actionable intelligence.
Mastering Data Scale: Grouping Large Datasets Intelligently
One of the biggest hurdles with large datasets is maintaining readability. Advanced generators provide powerful options to group data, ensuring your plot offers both a macro overview and the ability to zoom into micro details.
The Art of Stem Width Selection
Choosing the right "stem width" is paramount. This isn't just about picking a leading digit; it's about defining the range that each stem represents. A generator allows you to dynamically adjust this setting, letting you experiment until the plot truly speaks to you.
- Consider the Data Range: What's the minimum and maximum value? A narrow range might benefit from smaller stem widths, while a broad range demands larger ones to prevent an excessive number of stems.
- Frequency of Values: If many values cluster within a small range, a smaller stem width can reveal internal structure. If values are sparse, a larger width might be needed to show overall trends.
- Analysis Purpose: Are you looking for general trends or fine-grained differences? Your objective dictates the level of detail you need the stem to represent.
Ultimately, optimal stem width is often found through experimentation. A good generator will let you adjust this parameter with a few clicks, instantly updating the visualization so you can iterate towards the clearest representation.
Strategic Data Intervals: Uniformity with Flexibility
Beyond just the stem width, advanced generators often allow you to define specific data intervals. This is incredibly useful for segmenting data according to meaningful boundaries. For example, if you're analyzing student scores, you might define intervals that correspond to grade boundaries (e.g., 90-100, 80-89, etc.).
This approach provides:
- Macro View: A quick glance reveals performance across broad categories.
- Micro View: Within each interval, the leaves still show individual scores, preserving the raw data integrity that's unique to stem-and-leaf plots.
The flexibility here lies in setting these intervals; they don't always have to be uniform in size, as long as they serve a clear analytical purpose.
Achieving Balance Through Iteration
Creating the perfect stem-and-leaf plot is rarely a one-shot deal. It's an iterative process, much like sculpting. You'll refine your stem width, experiment with different intervals, and review the resulting visualization. A key best practice is to supplement your visual observations with descriptive statistics—like the mean, median, and variance—to confirm what your eyes are telling you. This cyclical process of adjusting, observing, and validating ensures your plot is both visually compelling and statistically sound.
Unveiling Finer Details: Modifying Stems for Clarity
Sometimes, the general shape of the data isn't enough; you need to peer closer to find the subtle shifts and clusters. Advanced generators offer specialized stem modifications to enhance this detail.
Split Stems: Magnifying Local Variations
Perhaps the most powerful customization is the "split stem." Instead of having a single stem for, say, all values in the 70s, you can break it into multiple parts. A common approach is to split each stem into two: one for values ending in 0-4 and another for values ending in 5-9. So, for stem "7", you'd have "7*" for 70-74 and "7." for 75-79.
This technique is invaluable for:
- Enhancing Detail: It "stretches" the plot vertically, making it easier to distinguish between closely clustered values.
- Revealing Local Variations: You might see a strong concentration of scores between 70-74 and another between 78-79 that would otherwise be lumped together in a single "7" stem.
- Clarifying Multimodal Distributions: If your data has multiple peaks, split stems can visually separate these peaks, making the distinct groups much more apparent.
- Example: AP Exam Scores (0-100): Imagine 500 AP exam scores. A standard stem width of 10 (stem "7" for 70-79) might create a dense, unreadable line. By splitting "7" into "7*" (70-74) and "7." (75-79), you might clearly see two distinct performance clusters among the passing scores, perhaps indicating different preparation levels or teaching methods.
Handling Decimal Data with Precision
Decimal data often presents a challenge. Should you round to the nearest whole number and lose precision? Or create incredibly long "leaves" with decimal points? Advanced generators offer elegant solutions:
- Smart Rounding: Configure the generator to round to a specified number of significant digits, minimizing precision loss while keeping the plot tidy.
- Decimal Points in the Leaf Area: For certain types of data, you can instruct the generator to include the decimal point as part of the leaf. For instance, a value of 4.7 could be represented as stem "4" and leaf ".7". This preserves the exact raw data without creating excessively long stems. The generator automatically aligns these, maintaining visual coherence.
Managing Tied Values and Outliers
When multiple data points share the exact same value (tied values), advanced generators help manage their display:
- Numerical Ordering: Leaves are always ordered numerically, making it easy to see the exact sequence of data points.
- Split Stems for Frequency: As mentioned, split stems can help visually differentiate high-frequency ranges.
- Additional Notations/Markers: Some sophisticated generators might allow subtle markers or notations for unusually high concentrations of tied values, especially when space is at a premium.
- Identifying Outliers: Because every data point is preserved, stem-and-leaf plots are excellent for spotting outliers—values that lie significantly outside the general pattern. Customization features can sometimes highlight these outliers with distinct symbols or colors, drawing immediate attention to them for further investigation.
Quantifying Variability: Enhancing Visuals with Standard Deviation
While a stem-and-leaf plot excels at showing data distribution and spread, sometimes you need to quantify that spread. This is where statistics like standard deviation (SD) become invaluable. Advanced generators, or their integrated analytical tools, often bridge this gap, allowing you to move seamlessly between visual and numerical insights.
What is Standard Deviation?
Standard deviation is a statistical measure that tells you how much individual data points typically deviate from the average (mean) of the dataset.
- Low SD: Data points are generally close to the mean, indicating high consistency or low variability.
- High SD: Data points are spread out over a wider range from the mean, indicating greater variability.
Think of it this way: a stem-and-leaf plot shows you if the leaves are tightly bunched or widely scattered. The standard deviation gives you a number that describes exactly how bunched or scattered they are. For example, if you're analyzing test scores, a small SD means most students scored similarly, while a large SD indicates a wide range of performance levels.
Many advanced stem and leaf tools, or companion data analysis platforms, can automatically compute standard deviation for your dataset. This allows you to immediately see the numerical measure of the spread you're visually observing in your plot. For instance, a stem and leaf plot generator might not only create your plot but also provide summary statistics, including the mean and standard deviation, right alongside it. This integration empowers you to confirm visual intuition with precise numerical values, enriching your understanding of the data's consistency and dispersion.
Understanding standard deviation is crucial in many fields: - Finance: A high SD for a stock's returns suggests higher volatility and risk.
- Quality Control: A low SD in manufacturing implies consistent product quality.
- Research: Small deviations indicate more reliable and reproducible experimental results.
By combining the visual power of an advanced stem-and-leaf plot with the quantitative power of standard deviation, you get a complete picture of your data's shape and spread.
Integrating for Deeper Insights: The Power of Combination
A stem-and-leaf plot, even with advanced customization, is just one tool in your data analysis toolkit. The real magic happens when you integrate it with other visualization and statistical methods. Advanced generators often facilitate this by offering export options or direct integration features.
Stem-and-Leaf with Histograms: Complementary Perspectives
- Histograms: Show the frequency distribution of data within predefined intervals (bins), giving you a clear picture of the overall shape and peaks.
- Stem-and-Leaf: Provides the same frequency distribution but also preserves every individual data point within those intervals.
When used together, a histogram gives you the broad strokes of the distribution, while the stem-and-leaf plot fills in the granular detail, allowing you to see exactly which values contribute to each bar of the histogram. They are two sides of the same coin, offering both summary and precision.
Overlaying with Box Plots: Summarizing Central Tendency and Spread
Box plots (or box-and-whisker plots) are fantastic for summarizing the central tendency, spread, and potential outliers of a dataset.
- Box Plot Benefits: They clearly display the median, quartiles (25th and 75th percentiles), and the range of the data, often highlighting outliers beyond the "whiskers."
- Stem-and-Leaf's Role: While a box plot gives you the summary statistics, the stem-and-leaf plot provides the context of the raw data. You can see why the median is where it is, or which specific data points form the quartiles and outliers.
Some advanced generators allow you to overlay box plots directly onto a stem-and-leaf plot or present them side-by-side for easy comparison, creating a robust, multi-layered view of your data. This is particularly useful when comparing datasets, as you can quickly highlight differences in medians, ranges, and outliers.
Frequency Tables as Numerical Supplements: Precision and Verification
Frequency tables serve as the precise numerical backbone for your visual observations. They tabulate the exact occurrences of each value or value range.
- Verification: After creating your plot, a frequency table can verify your visual observations, ensuring accuracy and providing exact counts for each stem or leaf.
- Detailed Counts: For presentations or reports, frequency tables offer the exact numerical backing for the patterns observed in the plot.
Many generators can automatically generate a frequency table from your dataset, making it easy to cross-reference and confirm your visual interpretations.
Case Studies in Action: Illuminating Complex Distributions
Let's look at how these advanced techniques play out in real-world scenarios.
- AP Exam Scores (Revisited): Using a stem width of 10 and then employing split stems (e.g., "7*" for 70-74, "7." for 75-79), we can go beyond just seeing "many scores in the 70s." The split stems might reveal a bimodal distribution within the 70s, indicating two distinct groups of test-takers, perhaps those who just barely passed and those who performed strongly but not exceptionally. This level of detail helps educators tailor interventions.
- Multimodal Distribution (Reaction Times): Imagine data from a psychological experiment measuring reaction times, where some participants respond quickly due to one cognitive process, while others respond slower due to a different, more complex process. A standard stem-and-leaf might show a broad, irregular distribution. However, by carefully adjusting stem widths and utilizing split stems, an advanced generator can clearly illustrate multiple distinct peaks, visually confirming the presence of these underlying processes. This offers far more insight than just seeing a single, wide average.
- Highlighting Skewness, Kurtosis, and Outliers: Because stem-and-leaf plots preserve every data point, they are incredibly effective for visually identifying the shape of a distribution:
- Skewness: You can clearly see if the "tail" of the data stretches more to the left (negative skew) or right (positive skew).
- Kurtosis: While harder to quantify visually, you can get a sense if the data is very peaked (leptokurtic) or very flat (platykurtic) compared to a normal distribution.
- Outliers: The individual leaves immediately draw attention to any data points that stand far apart from the main body of the data, prompting further investigation into their cause.
Best Practices for Effective Presentation
Generating insightful plots is only half the battle; presenting them effectively is equally crucial. Advanced generators often come with features to enhance your presentation.
- Clear Annotations: Always label your stems and leaves clearly, and include a key that explains any split stem notations (e.g., "7* = 70-74"). Add titles and axis labels where appropriate.
- Integrate Narrative with Visuals: Don't just show the plot; tell the story it reveals. Explain what the distribution means, point out key clusters, gaps, or outliers, and connect these observations back to your analytical objectives.
- Cite References: If you're using real data, ensure appropriate sourcing.
- Tailor Technical Detail to the Audience: A report for fellow statisticians can delve into the nuances of stem width and split stem rules. A presentation for a general audience might focus more on the "so what" of the distribution. A good generator allows you to create versions with varying levels of detail, from raw plots to highly polished, annotated graphics.
Beyond the Plot: Leveraging Your Data for Decisions
The power of advanced features and customization in stem and leaf generators isn't just about creating prettier plots; it's about enabling deeper, more nuanced data exploration. By allowing you to manipulate how data is grouped, detailed, and combined with other statistical tools, these generators empower you to move beyond superficial observations.
You gain the ability to:
- Uncover hidden patterns in complex datasets.
- Make informed decisions based on a thorough understanding of data distribution.
- Communicate insights with clarity and confidence.
So, the next time you face a challenging dataset, don't settle for a basic visualization. Dive into the advanced features of your stem and leaf generator. Experiment with different stem widths, split stems, and integration options. You'll be amazed at the profound insights you can unearth, transforming raw numbers into a compelling story that drives intelligent action.